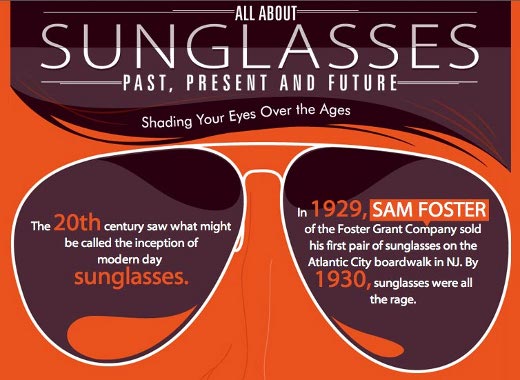
Many small businesses use infographics to raise their visibility. They hope to get them to go viral and to increase incoming links from quality blogs to their sites. This is an example of a new type of infographic that is interactive. (You have to click on the image below to see it.)
History of Sunglasses Infographic ~ Interactive
CTS Wholesale Sunglasses commissioned this infographic. It is the first I’ve seen that is interactive in this particular manner. (Click the image above to play with it.)
Many love infographics; a few hate them,
but research shows that they ARE effective.
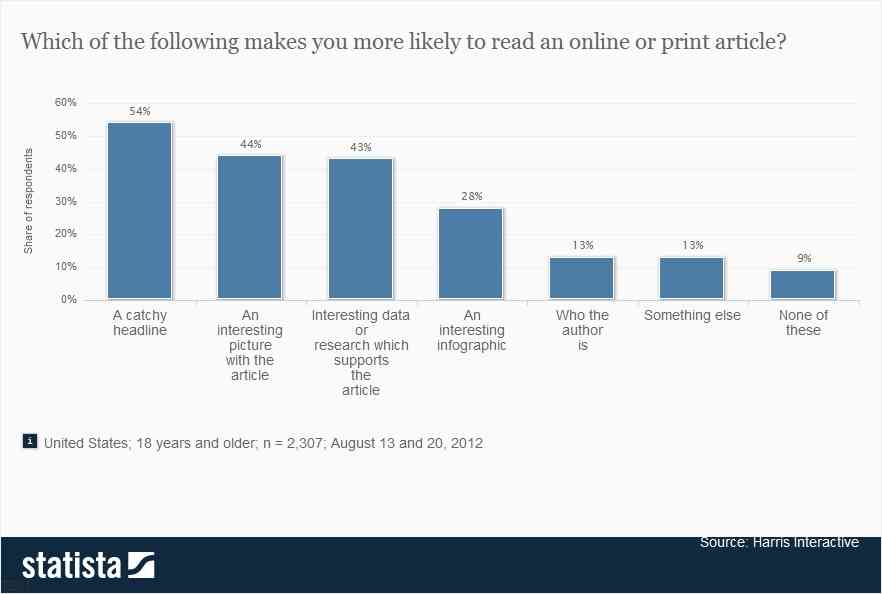
Harris Interactive research shows infographics are the fourth most compelling reason for reading content. 28% of those polled chose infographics. (See the chart below.)

WHY DO PEOPLE READ CONTENT?
Here are the factors research shows are most important to getting your content read:
- 54% ~ A catchy headline
- 44% ~ An interesting picture, photo, or image
- 43% ~ Interesting data or research which supports the article
- 28% ~ An interesting infographic
- 13% ~ Who the author is
- 13% ~ Something else
- 9% ~ None of these
Interactive Infographics
Infographics have been around long enough now that publishers are looking for ways to make theirs unique so they have a better chance of going viral. According to Econsultancy in Five Exceptional Interactive Infographics and Why They Worked:
“The bar for infographic quality has been raised. After three years of brands from every niche jumping onto the trend, it’s become increasingly difficult for infographics to stand out and gain the attention they promised back in 2010.”
Venture Beat refers to interactive infographics as live webgraphics. Julia Gifford writes:
“Infographics have become an outdated method of data visualization. Recent developments in technology have allowed a new breed of data visualization to emerge — a prettier, more informative, easier to understand, and more marketer-friendly version.
These new, more interactive graphics are about
to push infographics out of the limelight.“
You can see more examples of interactive infographics in Glen Elkins’ Five Things You Need to Know about Interactive Infographics. What are the five things?
- People actually use them.
- They can do more.
- Google will love you.
- Things go viral.
- They increase your conversions.
See his post for additional details on each of those points.
Video Infographics
But before you go for an interactive infographic, consider whether a video infographic would work better for you. You’ve probably seen them, but didn’t think to call them an infographic.
The reason video might be the better choice is that it is more mobile friendly – and mobile growth is exploding. Video is easier to view on the smaller screens on smart phones and tablets. See these posts to see stats on this astounding growth:
- Why Your Business Needs to Be On Instagram
- Why Photo Sharing Via Instagram Is the Next Big Social Wave
Interactive infographics have proven to be more compelling to play with, but video infographics are better for mobile devices. You probably already realize that when you merge one with other you get a video game or mobile app.
Watch for businesses using more of all of these in the coming years. If you’re a small business, don’t go overboard. Choose just one and learn to promote using that one. Contrary to what many believe, almost nothing goes viral organically. A lot of hours, hard work and building relationships and connections are behind almost anything viral you’ve seen.
Infographic Design Creators
There is a controversy over whether the infographics creator should get attribution on the infographics they make. You will see that Infographic Design Agency NowSourcing is easy to find because their logo is on the infographics they create. On many traditional sites, infographics are not branded so it is not easy to find out who created them.
SEO expert Bill Hartzer feels since the business pays for the infographic they should not have their logo on it. The downsides to that are that viewers won’t have the brands reputation to rely on regarding the quality of the content in the infographic and those interested in having that company create one for them can not easily determine who made the infographic to hire them.
- Brian Wallace @NowSourcing has built a business researching and designing the very best infographics. See Nowsourcing.com for how to hire Brian and his team. Bloggers can find many infographics to enhance their content in the Nowsourcing infographic portfolio. They have an extensive distribution network which is a major reason to hire them for infographic research and creation.
- Infographic Design Team created the History of Sunglasses infographic for CTS Wholesale used as an example at the top of this post.
How to Create Infographics
While you are better off hiring an agency that has a distribution channel already in place, if you can’t afford that here are some resources for creating your own. Just remember you will have to promote it yourself, too – and that is no easy task. See the next section for how-to promote infographics.
How to Promote Infographics
- Lee Oden, TopRank: Infographic Marketing Tips: 11 Ways to Promote
- Neil Patel, QuickSprout: 5 Ways to Get Your Infographic to Go Viral
- Neil Patel, SearchEngineJournal: A Quick and Dirty Guide to Modern-Day Link Baiting
- YouMoz: Promoting Infographics: Fear and Challenges in Link Building: Hard-boiling Experiment with 4 Interactive Infographics.
Infographic Case Studies
- MarketingSherpa: Content Marketing: Interactive infographic blog post generates 3.9 million views for small insurance company( (Nov 15, 2012)
- MarketingSherpa: Infographic: Customer experience in the digital age (Apr 30, 2013)
- MarketingSherpa: Mobile Search [Infographic]: 72% of smartphone users look for information on the go (May 11, 2012)
Disclosure: Gail @GrowMap advised CTS Wholesale Sunglasses in the past. We appreciate any shares of this post and sharing or republishing of their infographic. Questions? Feel free to contact Gail using the contact tab on this site. Connecting on Skype to growmap works fastest.

